
Page 9 - ActsAnnual Report 2018
P. 9
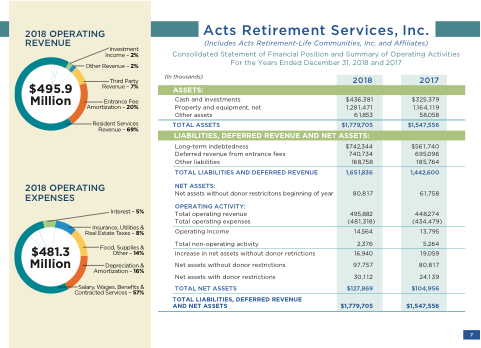
 2018 OPERATING REVENUE
Investment Income – 2%
   $495.9 Million
Other Revenue – 2% Third Party
 2018 OPERATING EXPENSES
Revenue – 7% Entrance Fee
 Amortization – 20% Resident Services
 Revenue – 69%
Interest – 5% Insurance, Utilities &
   $481.3 Million
Real Estate Taxes – 8% Food, Supplies &
 Other – 14% Depreciation &
 Amortization – 16%
Salary, Wages, Benefits & Contracted Services – 57%
  ASSETS:
2018
$436,381 1,28 1,47 1 61,853
$1,779,705
2017
 $325,379 1,164,119 58,058
$1,547,556
 LIABILITIES, DEFERRED REVENUE AND NET ASSETS:
$742,344 740,734 168,758
1,65 1,836
80,817
495,882 (481,318)
1 4,564 2,376
16,940 97,757 30,112 $127,869
$1,779,705
$56 1 ,740 695,096 185,764
1,442,600
61,758
448,274 (434,479)
1 3,795 5,264
1 9,059 80,817 24,1 39
$104,956
$1,547,556
 7
Acts Retirement Services, Inc.
(Includes Acts Retirement-Life Communities, Inc. and Affiliates)
Consolidated Statement of Financial Position and Summary of Operating Activities For the Years Ended December 31, 2018 and 2017
(In thousands)
Cash and investments Property and equipment, net Other assets
TOTAL ASSETS
Long-term indebtedness
Deferred revenue from entrance fees Other liabilities
TOTAL LIABILITIES AND DEFERRED REVENUE NET ASSETS:
Net assets without donor restricitons beginning of year
OPERATING ACTIVITY:
Total operating revenue Total operating expenses
Operating Income
Total non-operating activity
Increase in net assets without donor retrictions
Net assets without donor restrictions Net assets with donor restrictions TOTAL NET ASSETS
TOTAL LIABILITIES, DEFERRED REVENUE AND NET ASSETS
